


What is a Spinning Top candlestick?
How does a Spinning Top candlestick work?
Difference between a Spinning Top and Doji
What is the best timeframe to use for the Spinning Top candlestick?
Forex is a volatile market where the slightest movement on the charts can significantly affect a trade. Traders ought to employ reliable tools to analyse market behaviour in real time with minimal risk. A Spinning Top candlestick is one of the most effective candlesticks for tracking market trends.
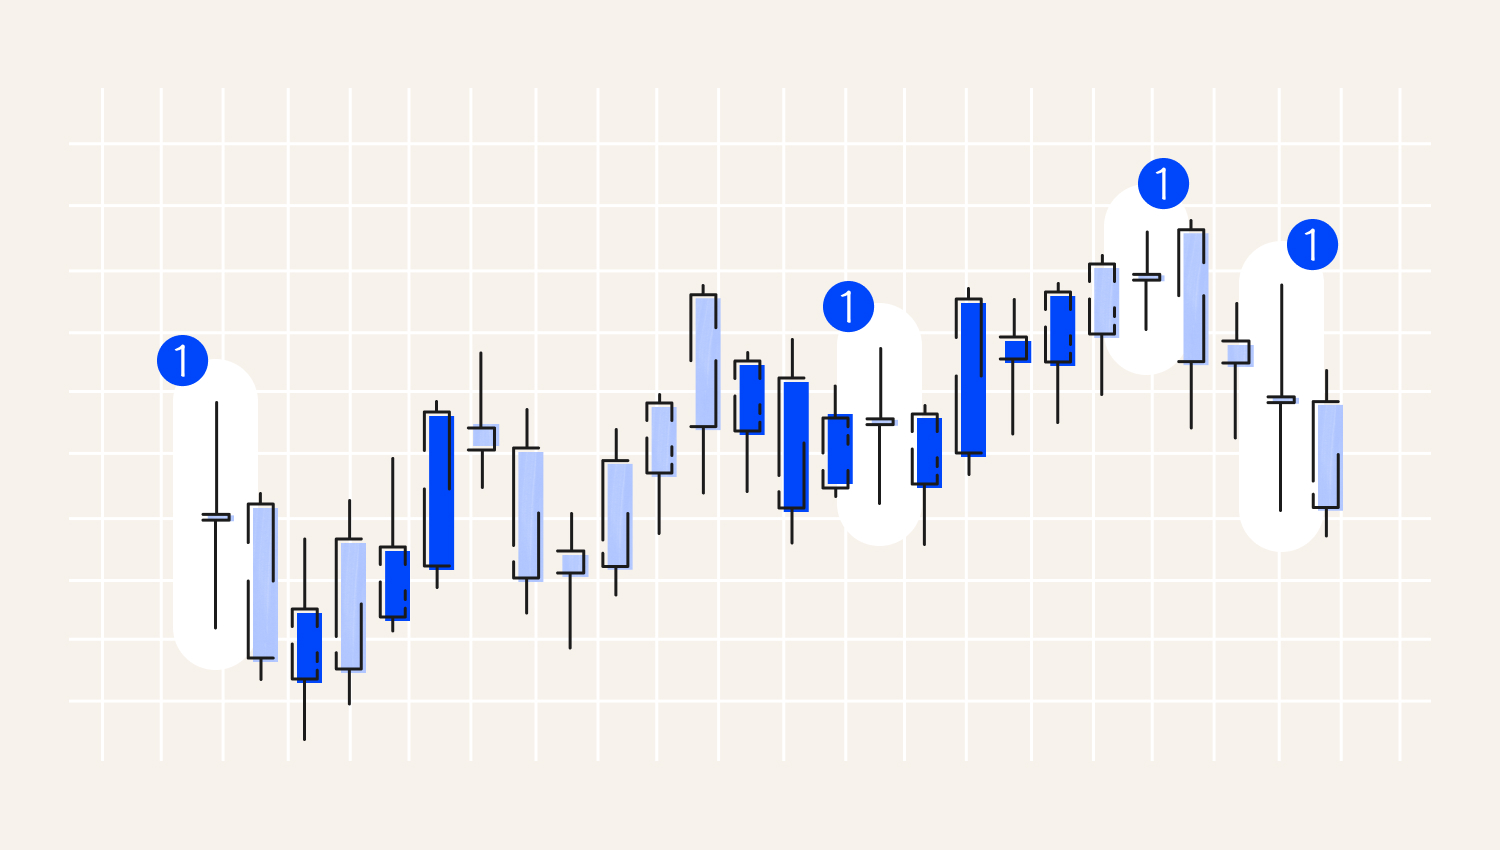
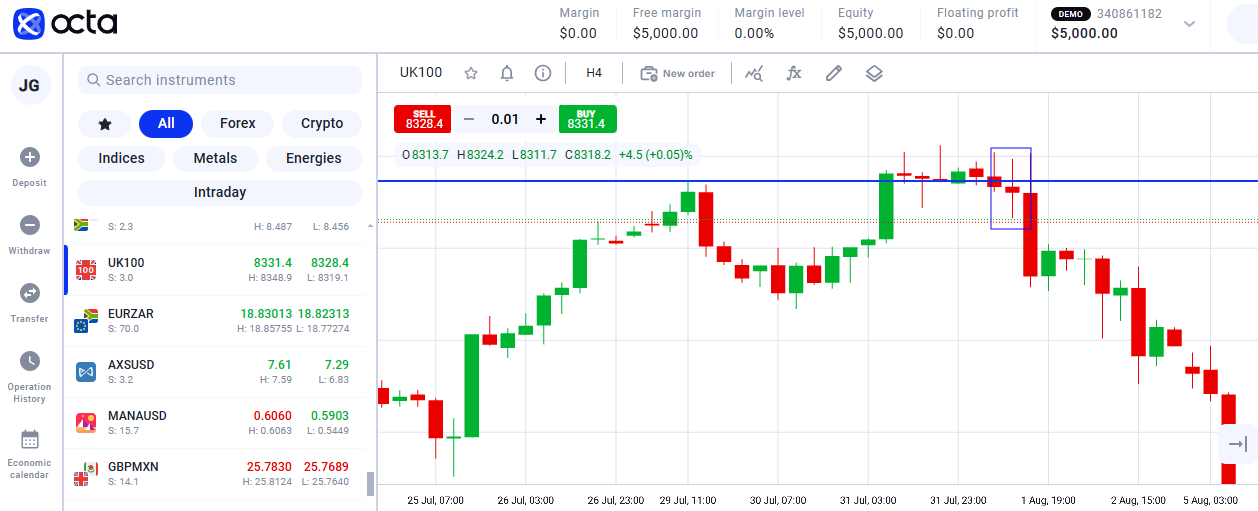
1. Spinning top
A Spinning Top candlestick is a technical analysis pattern showing market uncertainty. Here are its main characteristics:What is a Spinning Top candlestick?
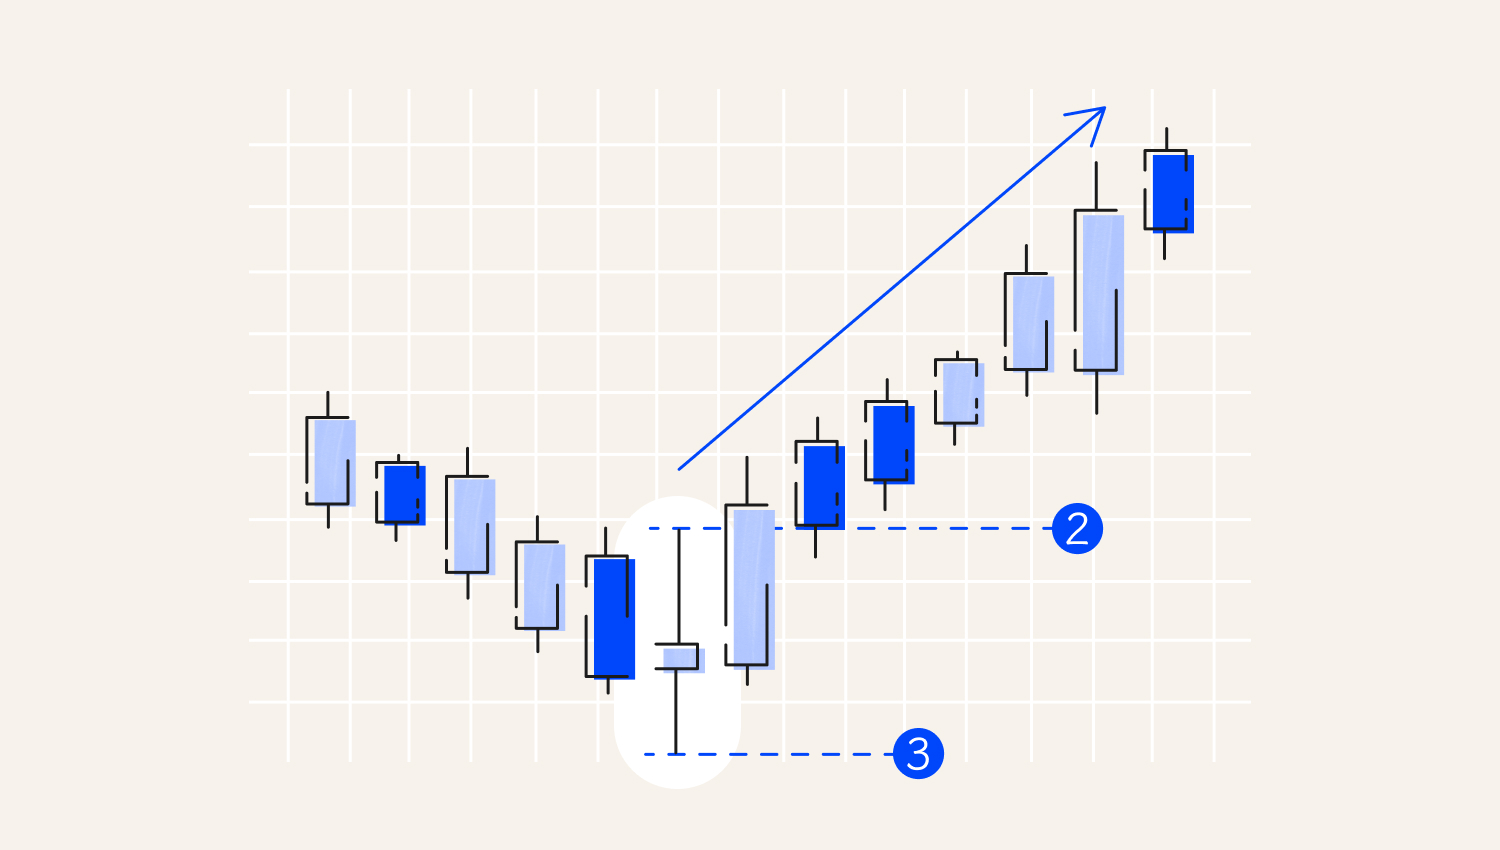
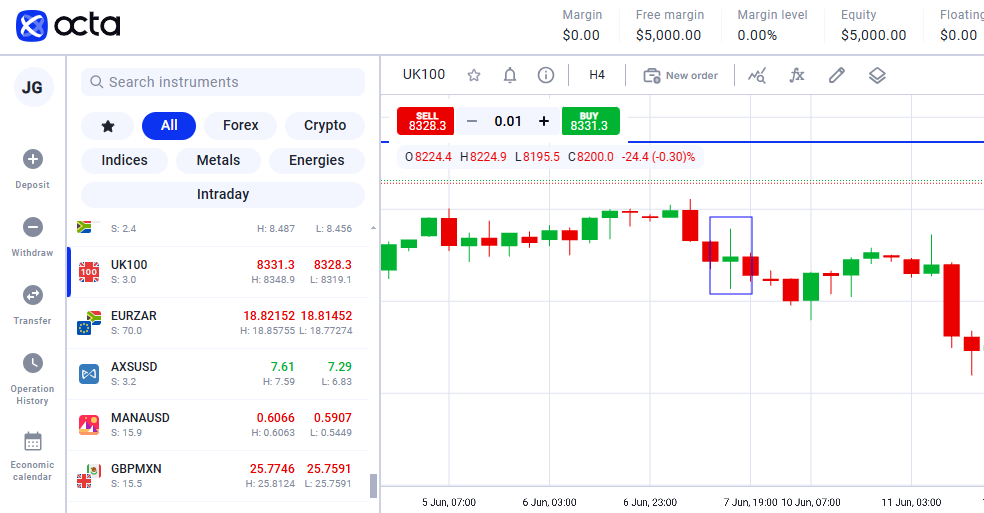
1. Entry level
2. Stop loss
Combined with other analysis tools, Spinning Top can help traders understand whether it is worth continuing to trade or exit a position.
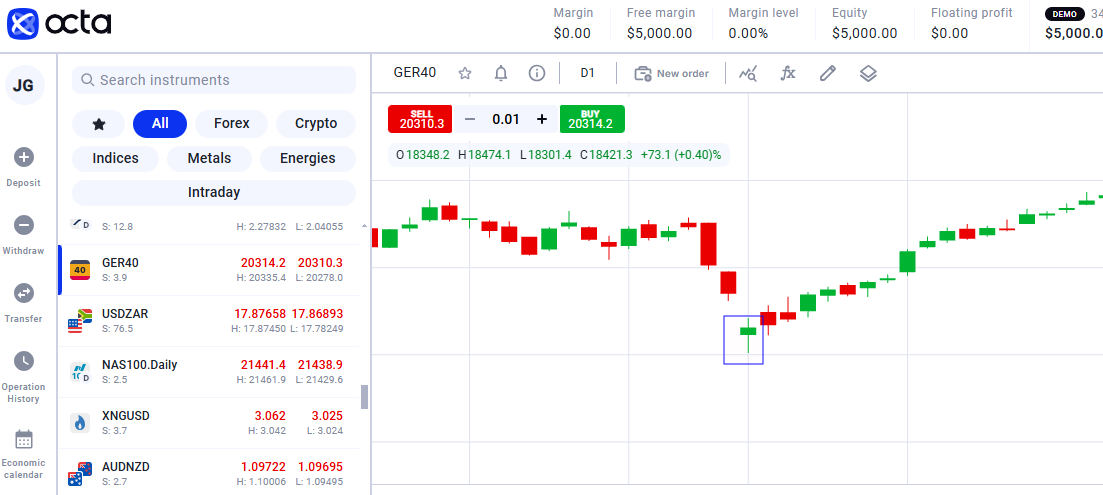
The Spinning Top candlestick appears in situations of uncertainty in the market, namely:How does a Spinning Top candlestick work?
In trading, both the Spinning Top and Doji are the candlestick patterns of technical analysis that signal market uncertainty. Despite the common goal they pursue, there are some differences in their structure and interpretation: Before engaging in Forex trading, it's crucial to thoroughly understand the differences between the Spinning Top and Doji patterns. This knowledge will ensure that traders are well-informed and prepared to make sound decisions and execute successful transactions.Difference between Spinning Top and Doji
Characteristics
Spinning Top
Doji
Body
It has a small body that indicates a slight difference between the opening and closing prices. Usually, the body is located at the top or bottom of the price range.
Doesn't have a body, or its body is too small, close to invisible. The opening and closing prices are almost the same. A Doji candlestick looks like a simple vertical line or a cross.
Shadows
Upper and lower shadows are always long.
Shadows can be long or short.
Signals
Indicates uncertainty in the market, with some degree of volatility. Sometimes, it can be used as a signal of a possible reversal or price consolidation.
Due to the absence of a body, Doji may be a stronger signal of uncertainty than Spinning Top.
Potential of using
Using the Spinning Top candlestick pattern, traders can swiftly analyse potential fluctuations and determine entry and exit points, empowering them to make confident trading decisions.
A Doji pattern demonstrates apparent neutrality. It can be used as a signal to wait for confirmation of the price direction before opening a trading position.
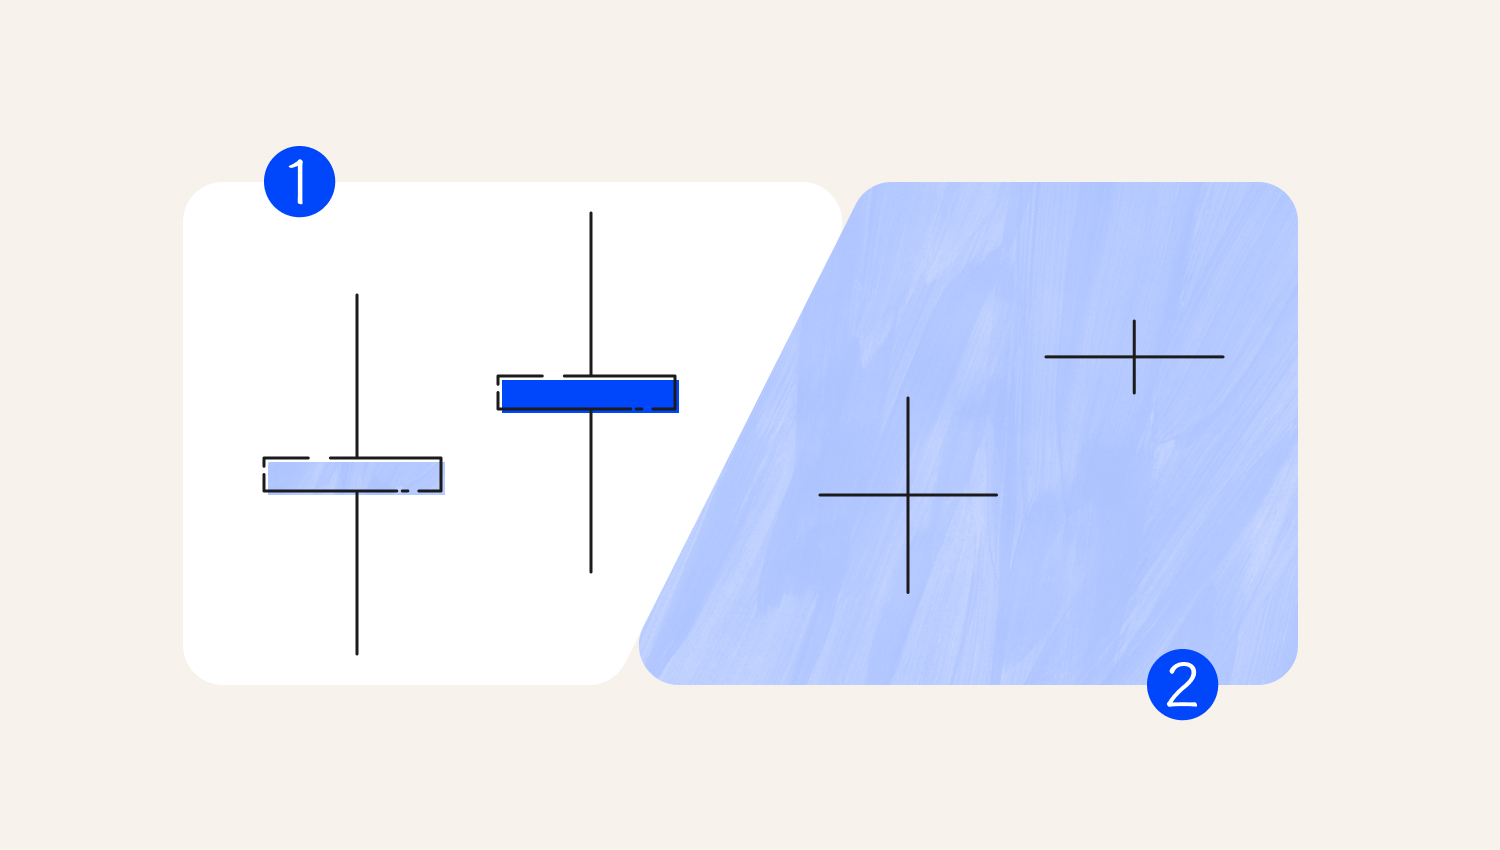
1. Spinning top
2. Doji
The effectiveness of the trading strategy depends on how traders use it. Suppose you carefully analyse the context, apply it to confirmatory signals, and know how to manage risks. In that case, the Spinning Top candlestick pattern will bring you the following benefits: Unfortunately, beginners and inexperienced traders who use the pattern for the first time risk getting an inaccurate analysis due to several disadvantages of the method:Pros and cons
Imagine that on the daily chart of the GBPAUD currency pair, the market trend has been bullish over the past few days. However, the Spinning Top candlestick appeared on the chart on the day. The candlestick has a small body and long upper and lower shadows, indicating significant price fluctuation during the day. Despite this, the closing and opening prices are almost equal. Here are the main characteristics of the candle: Now, let's take a look at the pattern's interpretation: If the price continues to rise for several days, but the fluctuations are already visible on the chart, this may indicate an upcoming change in direction. There is a strong possibility of a trend reversal in the coming days.Example
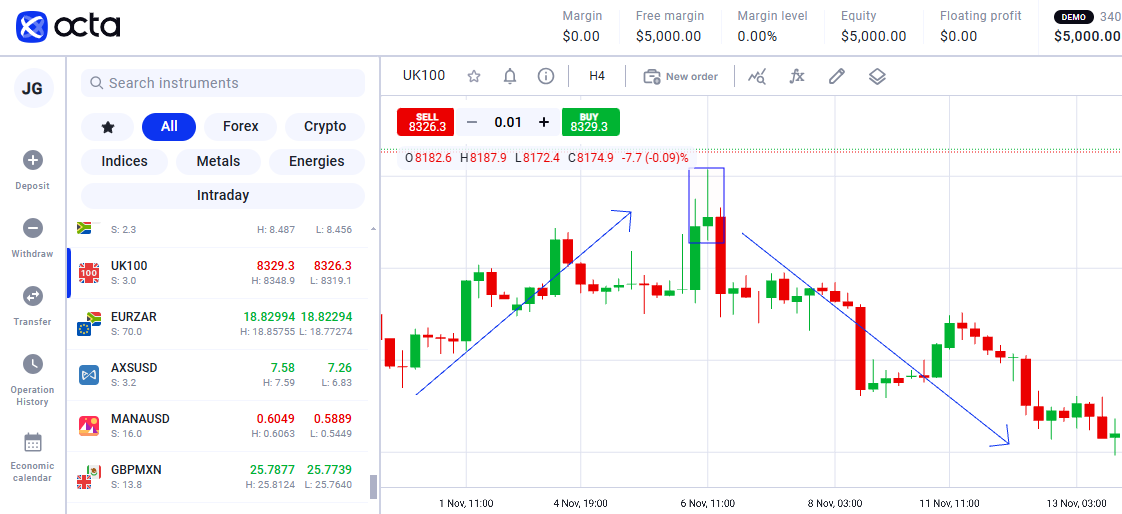
Most experts say that the Spinning Top candlestick pattern works best in the timeframe of daily bars. This model is effective for several reasons: However, it would help if you chose a suitable timeframe based on your trading strategy. Use weekly charts to identify significant market trends if you are a long-term trader. Those who prefer intraday trading should turn to hourly charts since they can identify short-term signals more clearly. A more versatile option is a four-hour chart. It provides enough information for analysis and is suitable for short—and medium-term trading.What is the best timeframe to use for the Spinning Top candlestick?
Final thoughts
