


How does the Diamond chart pattern work?
Types of the Diamond chart pattern
How to identify the Diamond pattern
How to trade using the Diamond pattern
What sets the Diamond pattern apart? It's a rare gem on charts, often overlooked by traders. Yet, this uniqueness may make it a valuable tool in trading. This article will give you an exclusive insight into this less common but potentially powerful trading tool. You'll find out how to spot it and what advantages and disadvantages come with using it in trading.
The Diamond chart pattern is a technical analysis tool widely used by traders in different financial markets. It is also used as a breakout trading strategy. Diamond patterns usually provide insights into potential breakouts and trend reversals. They can be bullish or bearish. The example below shows both structures of the Diamond pattern.What is the Diamond pattern?
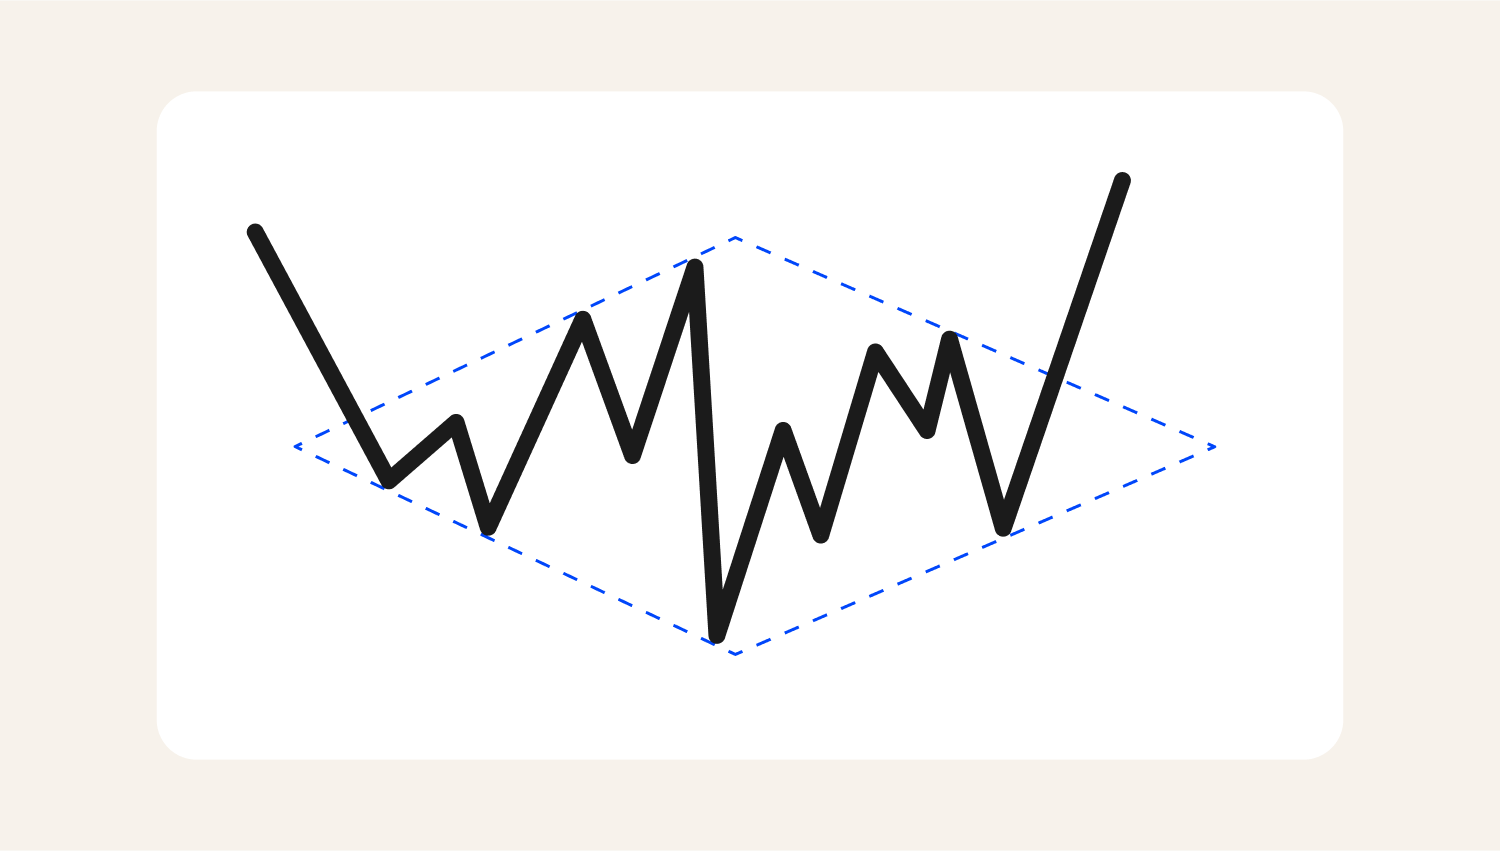
A Bullish Diamond pattern forms when the market is bearish, thus signalling a potential reversal.
.png)
A Bearish Diamond pattern forms when the market is bullish, signalling a potential reversal.
Diamond patterns, especially on longer timeframes, are known for their reliability. In shorter timeframes, they are more likely to produce false signals, but with the right understanding, you can still use them effectively.
The Diamond pattern occurs after either a bullish or bearish market. The market consolidates at the peak, indicating equal buying and selling pressure. The pattern signifies losing momentum on a trend, thus a potential reversal. The market forms a distinct diamond shape. The pattern completes only when the price exceeds the upper or lower trendlines. Suppose the breakout occurs above the upper trendline. In that case, it suggests that bulls have regained control, indicating that traders should consider entering new long positions. Conversely, a breakdown below the lower trendline signals that bears have overwhelmed demand, likely leading to a bearish trend. Diamond patterns are more distinct on real-time trading charts than in diagrams. But if the pattern follows the logic of highs and lows and is more or less diamond-shaped, it is a Diamond.How does the Diamond chart pattern work?
The table below summarises the essential features that define this pattern.Key characteristics
Characteristic
Meaning
Price consolidation
The Diamond pattern forms when a price stabilises after a trend. It creates a symmetrical diamond shape with upper and lower trend lines, indicating decreasing volatility as momentum slows.
Timeframes
The Diamond pattern is formed across all timeframes. However, the higher timeframe pattern allows the trendlines to form correctly. If the timeframe is too short or long, it may weaken the signal.
Volume
As the price consolidates, trading volume should decrease, showing that buying and selling pressure is weakening. A significant increase in volume during the breakout confirms a new trend.
Spikes and breakouts
A valid breakout occurs when the price closes outside the upper or lower trendline, indicating that one side has gained control, suggesting a reversal of the previous trend.
There are two types of Diamond patterns. They are easy to identify visually, but it is essential to comprehend what each one means. The Diamond Bottom pattern is a bullish signal. It indicates a reversal from downward (bearish) momentum to upward (bullish) momentum. Let's look at the following case. The market has been in a downtrend for several weeks. Over two months, the price began to stabilise, forming a distinct diamond shape on the chart. The pattern developed as the price created lower highs and higher lows. The upper trend line connects these lower highs, and the lower trend line connects the higher lows, illustrating increasing volatility. During the consolidation phase, trading volume decreases, indicating weakening selling pressure. The volume increases as the price approaches the breakout point, signalling potential bullish interest. A breakout occurs when the price closes above the upper trend line (at 1.1800) with a noticeable surge in volume. This breakout indicates that buyers have taken control, suggesting a reversal of the downtrend to a bullish phase. You enter a long position at 1.1825, set a target at a significant resistance level of 1.2000, and place a stop loss at 1.1750. As momentum builds, the price rises to the target of 1.2000, allowing you to lock in profits. For example, the breakout to the upper side indicates a potential bullish trend in a bullish diamond. Thus, traders ought to look for long entries.Types of the Diamond chart pattern
Diamond Bottom (Bullish)
Diamond Top (Bearish)
A Diamond Top is a bearish reversal pattern that appears after an uptrend. It signals a potential price decline as the market transitions from bullish to bearish.
The formation consists of two symmetrical triangles that converge, and higher and lower lows characterise them. Initially, the price makes higher and lower lows, reflecting a struggle between buyers and sellers. As the pattern develops, volatility decreases, indicating indecision among traders. A breakdown below the lower trendline confirms the reversal, prompting traders to consider short positions.
To illustrate a Diamond Top pattern, let's take the EURUSD currency pair. It has been trending upwards for a few weeks, reaching a high of around 1.1500. The price makes higher highs and lower lows, creating the left side of the Diamond. It rises to 1.1500, then pulls back to 1.1400, followed by another high at 1.1550 and another low at 1.1450.
As the pattern progresses, volatility decreases, narrowing the price range. On the right side of the Diamond, the price forms lower highs at 1.1520 and higher lows at 1.1460. The pattern is complete when the price breaks below the lower trendline at around 1.1450. This breakout signals a potential bearish reversal.
Upon confirming the breakout below 1.1450, traders enter a short position. To manage risk, they place a stop-loss order above the last swing high—around 1.1550. We can calculate Profit targets by measuring the height of the Diamond formation (the distance between the highest point and lowest point) and projecting this downward from the breakout point.
If executed correctly, this strategy can yield significant profits as the price declines following the breakout, potentially reaching targets based on the initial height of the Diamond pattern.
.png)
1. Bullish trend
2. Breakout of Diamond pattern
3. Target
Diamond Continuation
A Diamond Continuation pattern occurs when price action forms a diamond shape but continues in the same direction after the formation. It acts as a pause before the price resumes its original trend.
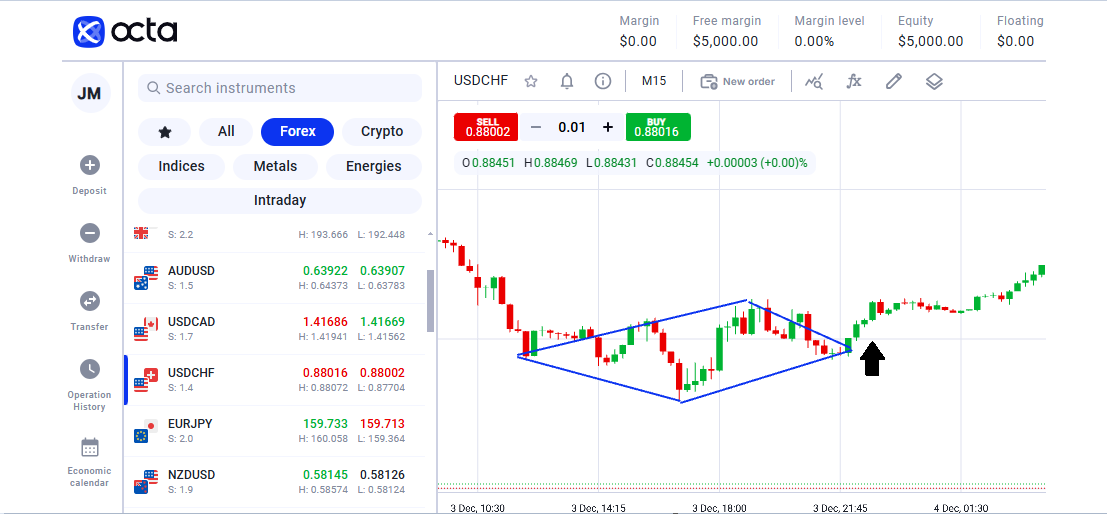
Let's model the following Diamond pattern Forex example. The GBPJPY pair has been in a strong uptrend for a few weeks. After reaching a high of 150.50, the price begins to consolidate and forms a Diamond Continuation pattern over three weeks.
The price action shows a series of higher and lower lows, creating a symmetrical diamond shape. The upper trendline connects the higher highs, while the lower trendline connects the lower lows, indicating a temporary pause in the uptrend.
During this consolidation, trading volume gradually decreases, reflecting a slowdown in momentum. However, as the pattern approaches completion, volume may spike slightly, indicating traders are positioning themselves for the next move.
A valid breakout occurs when the price closes above the upper trend line at 150.30 with considerable volume. This means that bullish momentum is resuming. You enter a long position at 150.35, setting a target at the previous high of 150.50 and placing a stop loss at 149.50 to manage risk. As the bullish momentum resumes, the price quickly rises to the target of 150.50, which allows you to secure profits.
.png)
1. Bullish trend underway
2. The Diamond pattern in the middle of the bullish trend
3. Target
To trade the Diamond pattern, follow the plan below:How to identify the Diamond pattern
To effectively trade using the Diamond pattern, traders should follow a structured approach encompassing identification, confirmation, entry, and risk management. Here's a detailed guide on how to trade this chart pattern.How to trade using the Diamond pattern
The Diamond pattern is rare but highly significant, as its advantages are undeniable. Why can you only partially rely on this pattern and use it with other tools? Because, like other trading tools, it could be better. Let's have a look at its disadvantages.Potential benefits and risks
Final thoughts
