Back
5 Sep 2018
Gold Technical Analysis: Recovering from hourly descending trend-channel support
• The precious metal stalled overnight slide near a support marked by a short-term descending trend-channel formation on the 1-hourly chart.
• Reviving safe-haven demand helped gain some positive traction on Wednesday, albeit resurgent USD demand capped any meaningful recovery.
• Technical indicators on the mentioned chart have started gaining positive momentum and thus, support prospects for some intraday up-move.
Gold 1-hourly chart
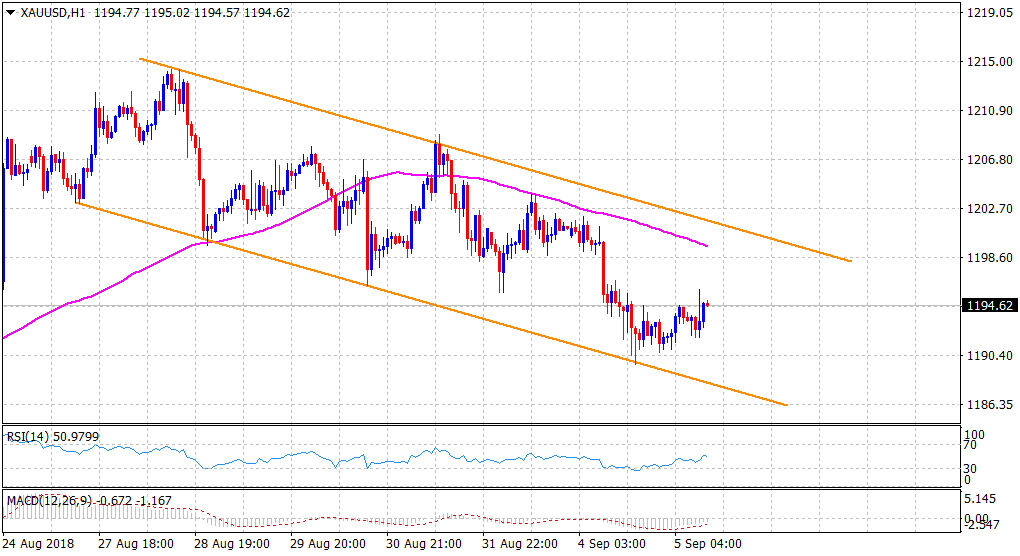
Spot Rate: $1194.62
Daily Low: $1190.90
Trend: Bearish
Resistance
R1: $1200 (psychological round figure mark)
R2: $1203.90 (weekly high set on Monday)
R3: $1206.81 (R2 daily pivot-point)
Support
S1: $1189.66 (overnight swing low)
S2: $1186.52 (S1 daily pivot-point)
S3: $1184.10 (horizontal zone)