Back
9 Mar 2020
USD/JPY Asia Price Forecast: Dollar plunges to three-year lows vs. yen amid market turmoil
- Investors are buying the Japanese yen as the equity markets are crashing.
- The level to beat for bears is the 101.51 support.
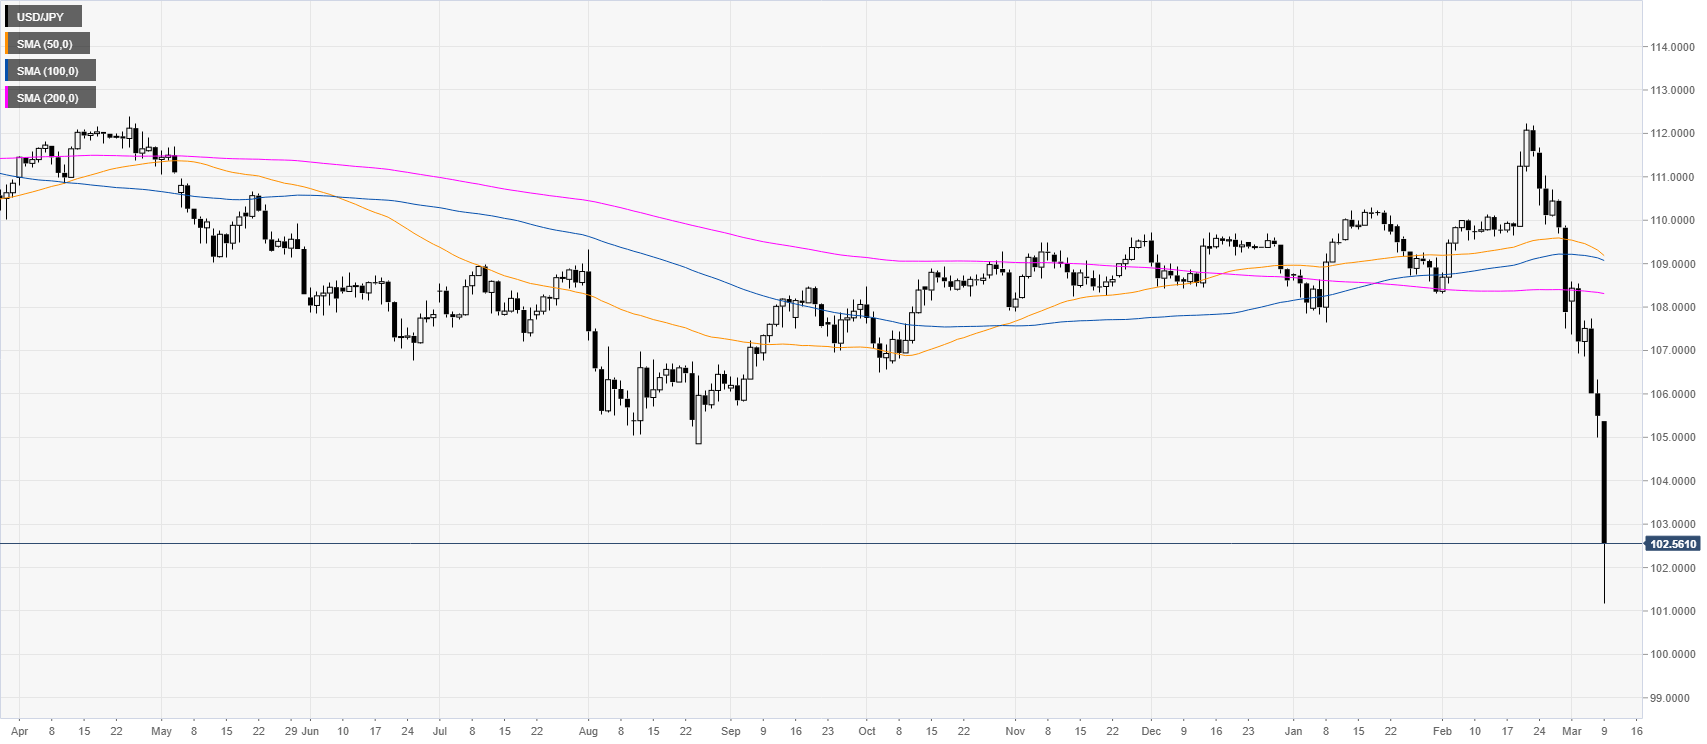
USD/JPY daily chart
USD/JPY is trading near three-year lows well below the simple moving averages (SMA) as the equity markets worldwide are selling off and at risk of recession.
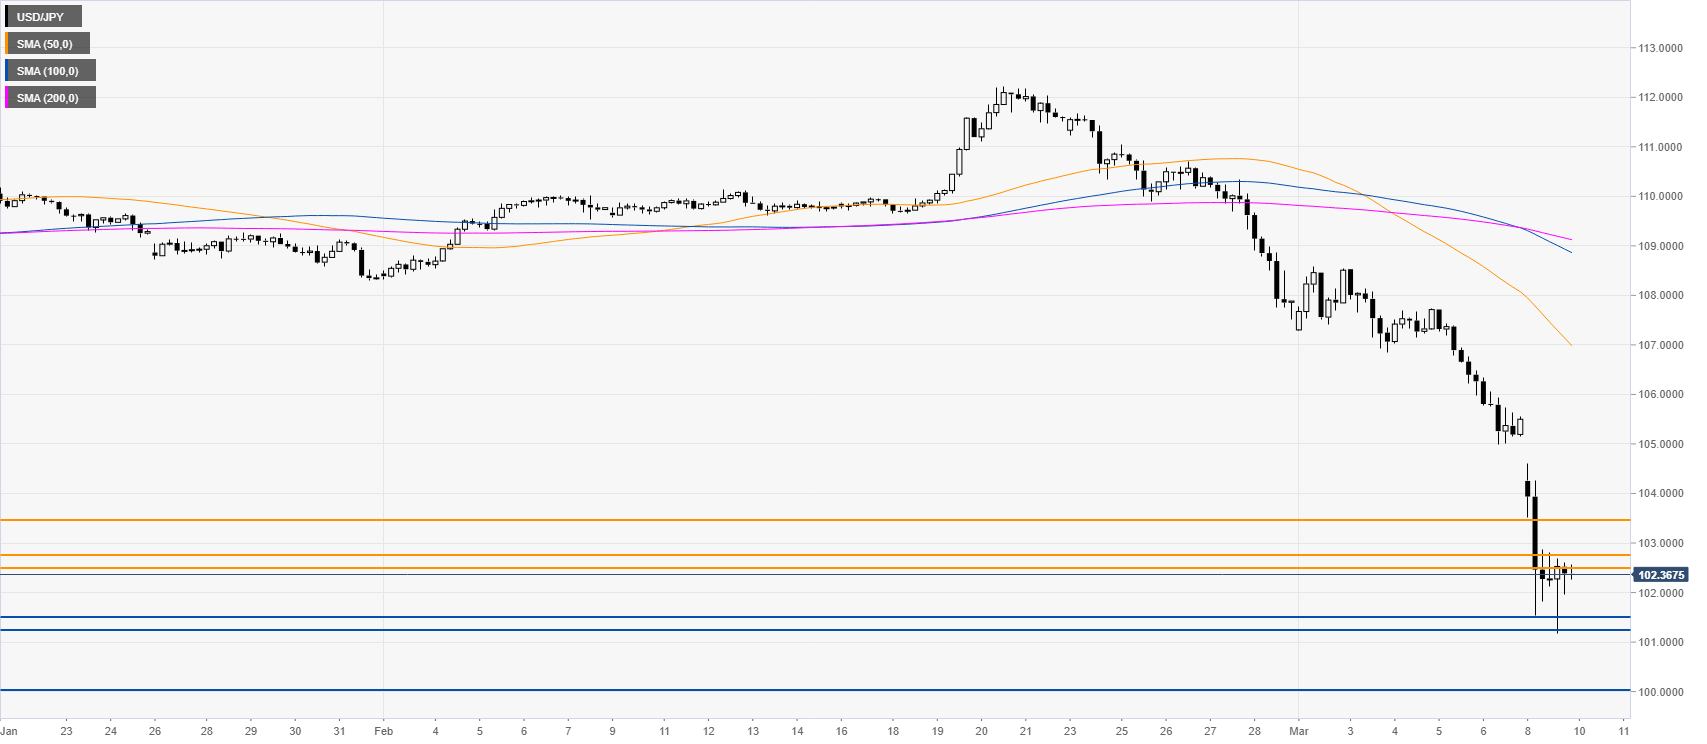
USD/JPY four-hour chart
USD/JPY is consolidating the recent freefall below the 103.00 figure. The bears remain in control and a break below the 101.51 support should lead to more losses towards the 101.20 and 100.00 levels, according to the Technical Confluences Indicator. Resistances are seen near the 102.47/79 resistance zone and the 103.43 level.
Resistance: 102.47, 102.79, 103.43
Support: 101.51, 101.20, 100.00
Support: 101.51, 101.20, 100.00
Additional key levels