Confirming you are not from the U.S. or the Philippines

By giving this statement, I explicitly declare and confirm that:
  • I am not a U.S. citizen or resident
  • I am not a resident of the Philippines
  • I do not directly or indirectly own more than 10% of shares/voting rights/interest of the U.S. residents and/or do not control U.S. citizens or residents by other means
  • I am not under the direct or indirect ownership of more than 10% of shares/voting rights/interest and/or under the control of U.S. citizen or resident exercised by other means
  • I am not affiliated with U.S. citizens or residents in terms of Section 1504(a) of FATCA
  • I am aware of my liability for making a false declaration.
For the purposes of this statement, all U.S. dependent countries and territories are equalled to the main territory of the USA. I accept full responsibility for the accuracy of this declaration and commit to personally address and resolve any claims or issues that may arise from a breach of this statement.
We are dedicated to your privacy and the security of your personal information. We only collect emails to provide special offers and important information about our products and services. By submitting your email address, you agree to receive such letters from us. If you want to unsubscribe or have any questions or concerns, write to our Customer Support.
Octa trading broker
Open trading account
Back

GBP/USD Price Analysis: Buyers and sellers jostle below 1.2300

  • GBP/USD looks for clear directions amid broad bearish trend.
  • Monday’s candlestick suggesting a trend reversal, oversold RSI question the sellers.
  • Buyers will wait for a sustained break of 200-day SMA for entry.

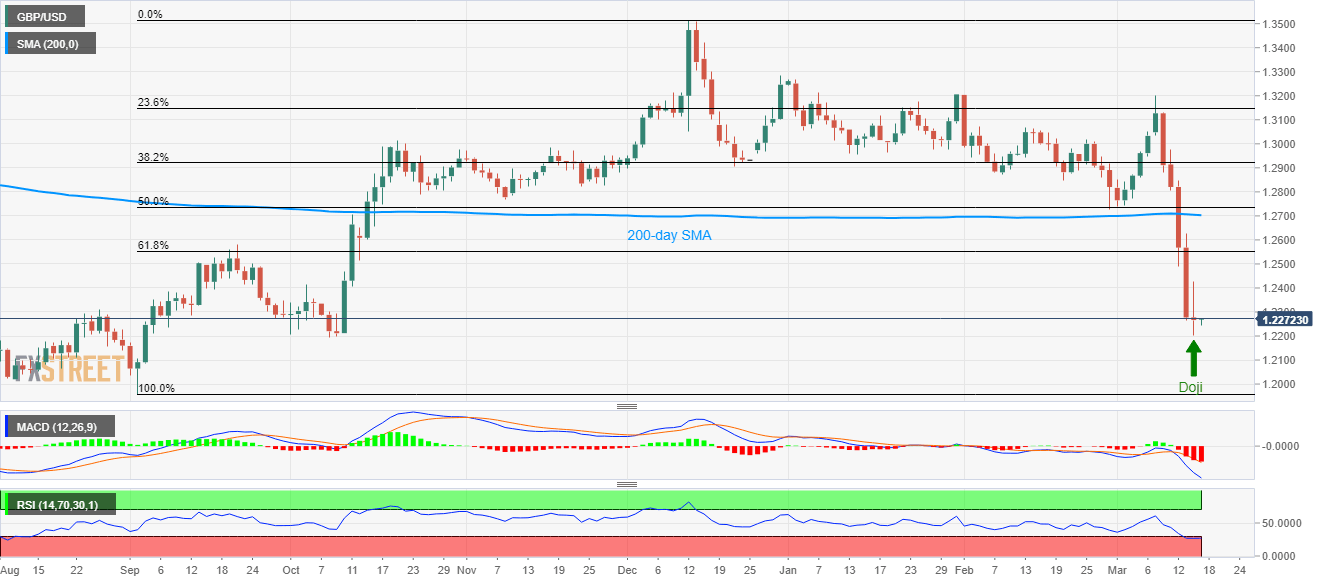
Having flashed a Doji candlestick formation on the daily (D1) chart, GBP/USD seesaws near 1.2270 during the Asian session on Tuesday.

The Cable searches for the clear catalyst as bearish MACD signals and trading below 200-day SMA keeps the sellers in command whereas a candlestick formation indicating trend reversal and oversold RSI pushes the buyers to look for entry.

Monday’s top near 1.2425 and 61.8% Fibonacci retracement of the pair’s September-December 2019 upside, around 1.2555, can offer nearby resistances to the quote ahead of 200-day SMA level of 1.2700.

In a case where the bulls manage to conquer 1.2700, November 2019 bottom surrounding 1.2820 will be on their radars.

Meanwhile, October 219 low near 1.2195 holds the key to the pair’s further downside, which if broken could drag the quote towards 1.2100 and then to September 2019 low surrounding 1.1960.

GBP/USD daily chart
Trend: Pullback expected


AUD/NZD corrects from lowest levels since 2015

AUD/NZD is trading at 1.1007 between a range of 1.008 and 1.0123 following a bullish correction at 1.0021 which met the 2011 lows. COVID-19 is having
Read more Previous

Death toll from coronavirus outbreak in China's Hubei at 3,111 as of end-March 16

Mainland China's total number of confirmed coronavirus cases hits 80,881 as of end-March 16. Key notes Total number of coronavirus deaths reaches 3,22
Read more Next